2.6 KiB
2.6 KiB
Coronamap
Coronamap is an interactive thematic map that animates the spread of the coronavirus.
Check out the deployment.
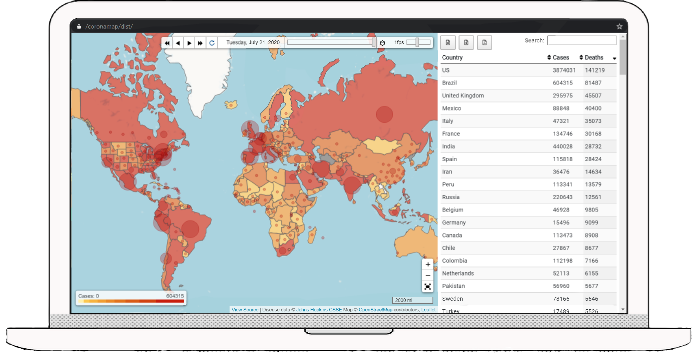
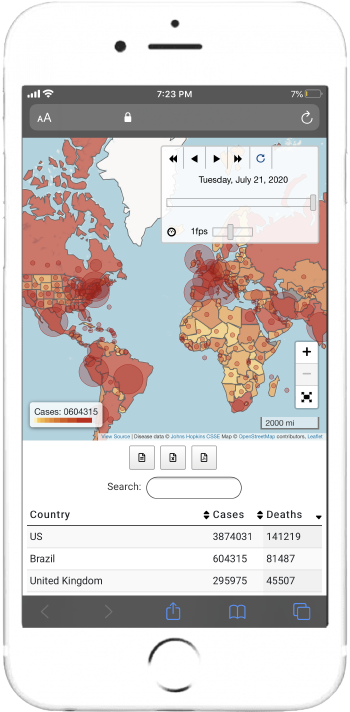
Preview
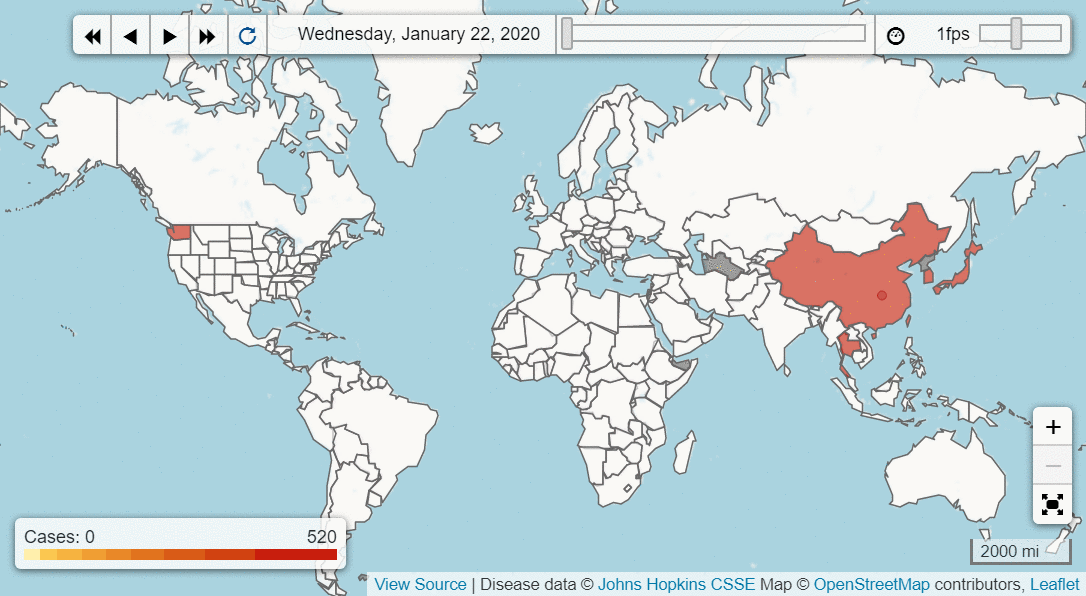
Date Slider

 : Play
 : Reverse
 : Move to the next day
 : Move to the previous day
 : Loop
 : Date progress bar
 : Playback speed
Colored Geographical Areas

The yellow-orange-red sequential color scheme shows the number of infected cases.
Circle Markers
![]()
![]()
![]()
![]()
![]()
The size of a circle marker scales to the number of deaths.
Getting Started
Prerequisites
- Node.js
$ yum install nodejs
$ yum install npm
- Install npm packages
$ npm install
Development
- Watch for updates to code and compile automatically:
npm run develop - Build the optimized production:
npm run build - Run all unit tests:
npm run test