 -
-  : Play
-
: Play
-  : Reverse
-
: Reverse
-  : Move to the next day
-
: Move to the next day
-  : Move to the previous day
-
: Move to the previous day
-  : Loop
-
: Loop
-  : Date progress bar
-
: Date progress bar
-  : Playback speed
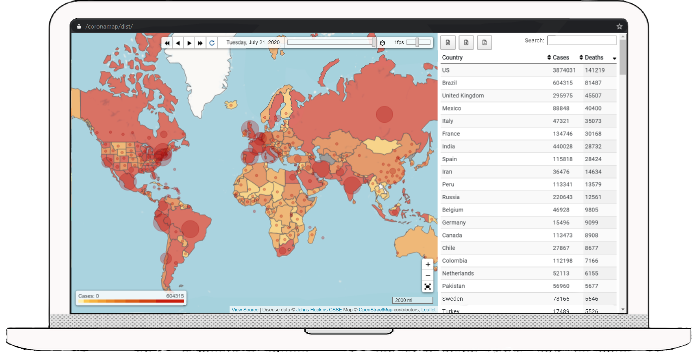
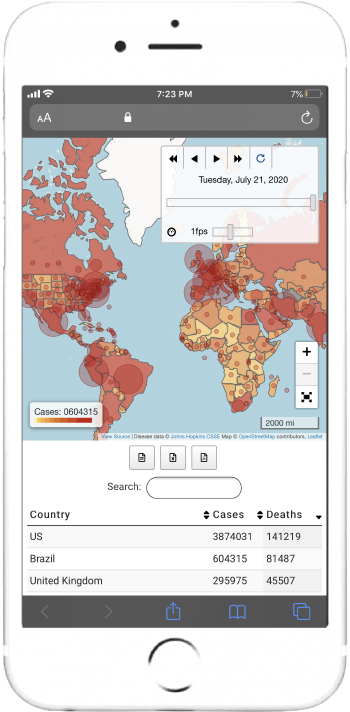
### Colored Geographical Areas
: Playback speed
### Colored Geographical Areas
 The yellow-orange-red sequential color scheme shows the *number of infected cases*.
### Circle Markers
The yellow-orange-red sequential color scheme shows the *number of infected cases*.
### Circle Markers